Actionstep reporting dashboard that helps you see your centre clearly.
View CLC turns your Actionstep data into clear, interactive Power BI dashboards, giving your team a practical way to monitor service delivery, understand client needs, identify operational pressure points and improve data quality.
ViewCLC
Business Intelligence Reporting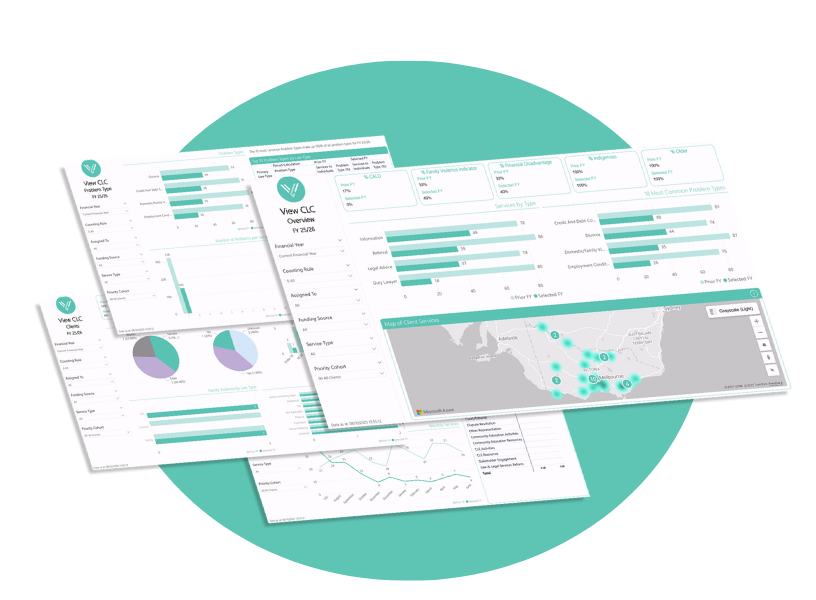
Built for the way Community Legal Centres need to report:
ViewCLC is designed to help CLCs move from static reporting to active visibility. Dashboards can be filtered by financial period, counting rules, assigned team members, funding source, service type and priority cohort groups, making it easier to answer specific questions without rebuilding reports from scratch.
Every report, one place
Click-through each report area to see what your team gets. Every page compares the current period against the last, so trends surface without manual work.
Overview Report
A high-level view of your centre's work — where services are delivered, which service types are most common, and which problem types appear most often.
- Map of client services — by postcode and suburb
- Services by type — vs previous period
- Top 10 problem types
- At-risk client statistics — CALD, family violence, financially disadvantaged, Indigenous, older

Services Report
Monitor service delivery by funding category, service type, and monthly trends — so your team understands demand patterns and walks into funding or board conversations prepared.
- Services by funding category
- Service details matrix — current vs previous period
- Monthly services trend — spot months of heightened demand

Clients Report
Understand who your centre is supporting — client demographics, priority cohorts, and the factors that matter for sector reporting.
- At-risk client statistics
- Clients by gender and age bracket
- Family violence indicators — and by law type
- Disability by type

Problem Types Report
Identify the most common problem types, see how they relate to law types, and understand how many issues are being recorded across services.
- Problem types trend — monthly, by problem type bins
- Top 10 problem types by law type
- Number of problems per service

Operational Reports
Team workload, distribution, and how long matters take to resolve — a practical view of operational pressure points for managers.
- Average duration of closed matters — by service type
- Assigned workload — active matters and open duration per lawyer
- Monthly open cases by main service type

Outcomes Report
For centres using custom data fields to track initial client objectives when a case opens — and the outcomes and financial benefits achieved once it closes.
- Client objectives at intake
- Outcomes achieved at closure
- Financial benefits tracking

Data Quality (QA) Reports
Funding reporting relies on complete records. The QA pages surface missing or invalid fields across clients and services — with hyperlinks straight into Actionstep to fix them — so issues are resolved before data goes to CLCA.
- Percentage of blanks — zero means no issues
- Data to fix — field-level, per matter
- One-click Actionstep links — open the flagged record to edit


Turn your Actionstep data into clearer decisions.
Practical visibility across services, clients, operations, problem types and data quality - refreshed overnight, ready every morning.